
 So, a few weeks ago I got a PiFace for my Raspberry Pi.
The PiFace is a clip on extension board for the Raspberry Pi which, together with the free library software, makes it super easy to control various real-world inputs and outputs – turning things on and off, and sensing whether switches have been pressed.
Pretty cool, but unfortunately due to my work load, and an ever growing to-do list, I had so far not had the time to play with it at all. However, a recent sports injury forced me to stay at home for a few days, and since I couldn’t really move (or indeed, put on my own socks), I decided to use this as an opportunity to play.
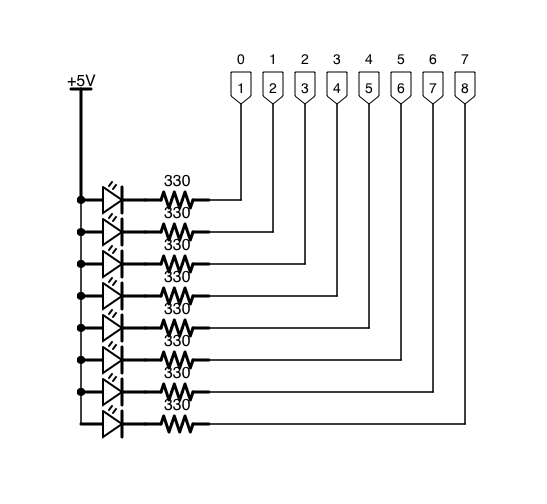
My first bit of tinkering was to see if I could wire up and take advantage of the 8 software controllable outputs exposed by the PiFace. These outputs consist of 9 connectors, the first of which is a 5 volt power line, and the other 8 being the ends of an open collector.
The Circuit
I am not an electrical engineer, so this is all brand new ground for me, and that is enough of a reason for me to find it all terribly exciting. These first bits of hardware hacking giving me the same thrill of figuring something out and getting something to work as when I wrote my first software programs all those years ago!
Anyway, the circuit is a simple one, and consisted of a breadboard with 8 leds connected in parallel with the 5 volt power rail on one side and the open collector terminal on the other. The back of the packet my LEDs in also noted that a resistor of 330 ohm should be used in series with the led when connected to a 5 volt power supply in order to avoid burning them out.
The Software
As a proof of concept, I wrote a bit of software to cycle through and turn each light on for a second, before turning it off and turning the next one on. Nothing too fancy right now!
The Finished Article
So, here’s my first experiment in action…
Like I said, I’m not an electrical engineer so this is hardly the Starship Enterprise, but I learnt a lot!
 So,
So,  The
The