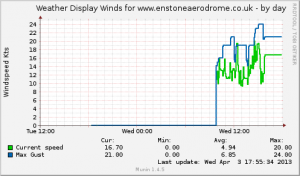
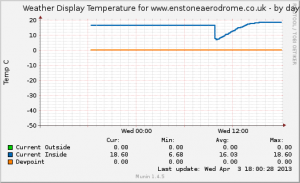
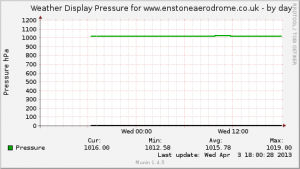
 Munin is a powerful and highly customisable network monitoring tool. It lets you collect data about pretty much anything, from the number of apache processes running, to the number of IP addresses blocked by fail2ban, to the current temperature of your CPU.
All this data is collected and graphed over time, and provides you with a powerful insight into the performance of your infrastructure, and helps track down the root cause of any failure or outage.
I monitor just about anything I can, and one of the many things that I graph are the number of PHP errors appearing in my apache logs. This gives me an idea of the overall health of some of the platforms that I develop, as well as spotting instances where I introduce a regression which would otherwise not be spotted.
Powering this, I use a munin plugin called loggrep, which, as the name implies, works by grepping a log file for a certain bit of regular expression and returning a count of every instance found. This is simple but very effective, however, it took a little bit of fiddling to get it working.
The symptoms
You install munin, and all the other plugins are present and generating graphs, but those generated by loggrep are missing. You follow the munin troubleshooting steps and you find that while you can connect to to the node and the plugin appears to be running and collecting data:
host #: telnet localhost 4949

# munin node at host

fetch loggrep_foo

count.value 35

errors.value 12

.
The plugin does not appear in the list when you telnet in and type “list“.
The fix
After a lot of hacking about, I managed to fix this, but there are a number of things that can catch you out.
- Patch the loggrep plugin: Loggrep, by default, seems to mis-report the host_name variable, displaying a file path to the plugin, you’ll see what I mean if you run
munin-run loggrep_foo config. Fix this by editing the munin loggrep plugin, which can usually be found in /usr/share/munin/plugins/, and change the line:
(my $host_name = $0) =~ s|.*_([^_]+)_.*|$1|;
to
(my $host_name = $name) =~ s|.*_([^_]+)_.*|$1|;
- Check your config: Check your loggrep configuration… the plugin will silently fail if there are duplicate labels in a configuration section, or if it is missing any of the required environment variables. So, for example, if you’ve got two
env.label_foo definitions defined either in the same section or in a section that overrides it, you will have problems.
- Check your plugin names: For some reason, probably related to the hostname regexp, when you create your symlink in
/etc/munin/plugins/ names like loggrep_foo will work, but names containing two underscores like loggrep_foo_bar will not.
This got it working for me, but of course YMMV. Hopefully, if you’re having the same problem, this’ll save you a few hours hair pulling!


 Munin is a powerful and highly customisable network monitoring tool. It lets you collect data about pretty much anything, from the number of apache processes running, to the number of IP addresses blocked by fail2ban, to the current temperature of your CPU.