Part of my day job is writing and maintaining a fairly massive and complex piece of software which has become mission critical for various large scientific infrastructures around Europe.

For reasons that will be familiar to anyone who’s built platforms that suddenly become successful, certain things were left out when building the software. One of these was any kind of monitoring.

We are of course building this out “properly”, however one of the simple things I did early on turned out to be a really big win. This was to simply catch all fatal errors and exceptions being thrown, and then pipe them to a slack channel set up for the purpose. With the help of clerk, this can be made easier.

Before adding the slack monitoring we’d often be surprised by error – receiving garbled reports third hand as they were escalated from a user email, through the administration team, and to us. By which time the detail has been lost, and any logs long since rotated away.

Our devs live in slack, and as a multinational team who’s members frequently travel, this has become the nervous system of the organisation. Now, my team is no longer surprised, and can jump on issues instantly.

Very very simple to set up, but turned out to be a big win. Here’s how

First, capture fatal errors in your application

I wrote about this before, about capturing WSOD errors, but assuming you’re using PHP, this is all about registering an exception and error handler for your application.

Create a slack app

Select “Incoming Webhooks” from application menu

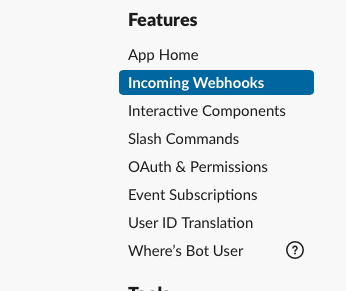
Next, create a slack application and add it to a monitoring channel in your work workspace.

Add an “Incoming webhook” for your app, that posts to your monitoring channel. This will give you a URL, anything POSTed to which will end up in your channel.

Posted text supports Markdown for formatting, which is handy if you want to post raw error messages etc, or links to data dumps.

Link the two

Finally, from your error handler, POST the error / stack trace / etc to your slack channel.

Conclusion

Obviously, this should be no replacement for proper monitoring. Proper monitoring can provide historic information and statistics about the overall health of your platform.

However, in the absence of this… this may be a quick win that you can implement without too much effort. Certainly for us, this proved to be invaluable, and allowed us to quickly diagnose and fix faults we were previously unaware of.

I manage a whole number of device and servers, which are monitored by various utilities, including Nagios. I also have clients who do the same, as well as using other tools that produce notifications – build systems etc.

Nagios is the thing that tells me when my web server is unavailable, or the database has fallen over, or, more often, when my internet connection dies. I have similar setups in various client networks that I maintain.

It logs to the system log, sends me emails, and in some urgent cases, sends a ping to my phone. All very handy, but isn’t very handy for other casual users who may just want to see if things are running properly. For those users, who are somewhat non-technical, it’s a bit much to ask them to read logs, and emails often get lost.

For one of my clients we had a need to be able to collect these status updates from different sources together, make it more persistent, and make it visible in a much more accessible way than log messages (which has a very poor signal to noise ratio) or email alerts (which only go to specific people).

“Known” issues

A solution I came up with was to create a Known site for the network which can be used to log these notifications in a user friendly, chronological and searchable form.

I created an account for my Nagios process, and then, using my Known command line tools, I extended the Nagios script to use my Known site as a notification mechanism.

In commands.cfg:

define command {
        command_name host-notify-by-known
        command_line echo "$HOSTNAME$: $HOSTSTATE$" | /etc/nagios/known_nagios_notify.sh
}
define command {
        command_name service-notify-by-known
        command_line echo "$HOSTNAME$ – $SERVICEDESC$ : $SERVICESTATE$. Additional info: '$SERVICEOUTPUT$'" | /etc/nagios/known_nagios_notify.sh
}

Then in conf.d/contacts.cfg I extended my “Root” contact:

define contact{
        contact_name                    root
        alias                           Root
        service_notification_period     24x7
        host_notification_period        24x7
        service_notification_options    w,u,c,r
        host_notification_options       d,r
        service_notification_commands   notify-service-by-email, service-notify-by-known
        host_notification_commands      notify-host-by-email, host-notify-by-known
        email                           root@localhost
        }

Finally, the script itself, which serves as a wrapper around the api tools and sets the appropriate path etc:

#!/bin/bash

PATH=/path/to/BashKnown:"${PATH}"

status.sh https://my.status.server nagios *YOURAPICODE* >/dev/null

exit 0

Consolidating rich logs

Of course, this is only just the beginning of what’s possible.

For my client, I’ve already modified their build system to post on successful builds, or build errors, with a link to the appropriate logs. This particular client was already using Known for internal communication, so this improvement was logical.

The rich content types that Known supports also raises the possibility of richer logging from a number of devices, here’s a few thoughts of some things I’ve got on my list to play with:

  • Post an image to the channel when motion is detected by a webcam pointed at the bird feeders (again, trivial to hook up – the software triggers a script when motion is detected, and all I have to do is take the resultant image and CURL it to the API)
  • Post an audio message when a voicemail is left (although that’d require me to actually set up asterisk, which has been on my list for a while now)
  • Attach debugging info & a core dump to automated test results

I might get to those at some point, but I guess my point is that APIs are cool.

At home, which is also my office, I have a network that has a number of devices connected to it. Some of these devices – wifi base stations, NAS storage, a couple of raspberry pis, media centers – are headless (no monitor or keyboard attached), or in the case of the media center, spend their time running a graphical front end that makes it hard to see any system log messages that may appear.

It would be handy if you could send all the relevant log entries to a server and monitor all these devices from a central server. Thankfully, on *nix at least, this is a pretty straightforward thing to do.

The Server

First, you must configure the system log on the server to accept log messages from your network. Syslog functionality can be provided by one of a number of syslog servers, on Debian 6 this server is called rsyslog.

To enable syslog messages to be received, you must modify /etc/rsyslog.conf and add/uncomment the following:

# Provides UDP syslog reception
$ModLoad imudp
$UDPServerRun 514


# Provides TCP syslog reception
$ModLoad imtcp
$InputTCPServerRun 514

Then, restart syslog:

/etc/init.d/rsyslog restart

Although this is likely to be less of an issue for a local server, you should ensure that your firewall permits connections from your local network to the syslog server (TCP and UDP ports 514).

The Clients

Your client devices must be configured to then send their logs to this central server. The concept is straightforward enough, but the exact procedure varies slightly from server to server, and device to device. If your client uses a different syslog server, I suggest you do a little googling.

The principle is pretty much the same regardless, you must specify the location of the log file server and the level of logs to send (info is sufficient for most purposes). In the syslog configuration file add the following to the bottom:

*.info @192.168.0.1

On Debian/Ubuntu/Raspian clients, this setting is in the /etc/rsyslog.d/50-default.conf file.

Some embedded devices, like my Buffalo AirStation, have an admin setting to configure this for you. Other devices, like my Netgear ReadyNAS 2, has a bit more of an involved process (in this specific case, you must install the community SSH plugin, and then edit the syslog configuration manually).

Monitoring with logwatch

Logwatch is a handy tool that will analyse logs on your server and generate administrator reports listing the various things that have happened.

Out of the box, on Debian at least, logwatch is configured to assume that only log entries for the local machine will appear in log files, which can cause the reports to get confused. Logwatch does support multiple host logging, but it needs to be enabled.

The documented approach I found, which was to create a log file in /etc/logwatch/conf didn’t work for me. On Debian, this directory didn’t exist, and the nightly cron job seemed to ignore settings in both logwatch.conf and override.conf.

I eventually configured logwatch to handle multiple hosts, and to send out one email per host, but modifying the nightly system cronjob. In /etc/cron.daily/00logwatch, modify the execute line and add a --hostformat line:

#execute
/usr/sbin/logwatch --output mail --hostformat splitmail

After which you should receive one email per host logged by the central syslog server.